


Infografz - Discover Interesting Infographics
Infografz - Discover Interesting Infographics介绍
Easily find facts, news, information and opinion as beautifully curated infographics (Information Graphics). Please note this is not an infographics editor app.
Find inspiration to design your own infographics by exploring content from various other sources of infographics.
Through a combination of the power of AI and intellect of our community, you can follow information from trusted sources on your smartphones. Whether it is a simple bar chart or a complex infographic with multiple data points, you will find thousands of infographics to read from diverse sources.
Explore Relevant Content:
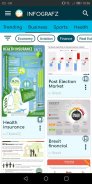
Get information on your areas of interest such as business, health, sports, education, environment, entertainment, science and technology.
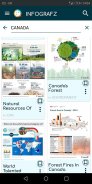
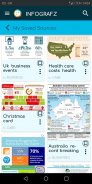
Infographics are classified by categories and topics. Within the main categories, users can explore topics of their interest by clicking on the text labels.
Our algorithms search even based on text inside the infographics to show relevant content to the users.
Explore Infographics In Detail:
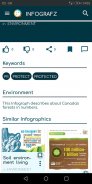
From the Infographics listing page, users can read an infographic in detail by clicking on the image. From there, they can search on topics of interest by clicking on the keyword bubbles.
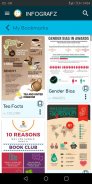
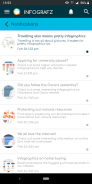
Users can bookmark Infographics for reference later. And they can share the knowledge through social sharing and rate on the content by liking, unliking and feedback.
Users can also explore new content by subscribing to sources. New content from the subscribed sources are shown in My Saved Sources screen.
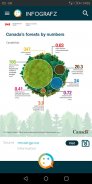
A slider style infographics that shows multiple datasets as charts is also available for reading.
Thousands of people are already using Infografz for:
1) Pictures speak thousand words, so they want to understand information quickly and not to mention the aesthetic appeal of infogeaphics
2) Explore information from various topics and sources
3) Get summary level information in a visual format without having to read lots of text
4) Read news headlines inshort
轻松地将事实,新闻,信息和意见查找为精心策划的信息图表(信息图形)。请注意,这不是信息图表编辑器应用程序。
通过探索来自其他各种图表来源的内容来寻找灵感来设计自己的图表。
通过结合AI的力量和我们社区的智慧,您可以在智能手机上跟踪来自可信赖来源的信息。无论是简单的条形图还是具有多个数据点的复杂信息图,您都可以找到成千上万的信息图,可以从各种来源中读取。
浏览相关内容:
获取有关您感兴趣的领域的信息,例如商业,健康,体育,教育,环境,娱乐,科学和技术。
信息图表按类别和主题分类。在主要类别中,用户可以通过单击文本标签来探索他们感兴趣的主题。
我们的算法甚至根据信息图表内的文本进行搜索,以向用户显示相关内容。
详细浏览信息图表:
用户可以从信息图表列表页面上单击图像来详细阅读信息图。从那里,他们可以通过单击关键字气泡来搜索感兴趣的主题。
用户可以将信息图表添加书签以供以后参考。他们可以通过社交共享来分享知识,并通过喜欢,不喜欢和反馈的方式对内容进行评分。
用户还可以通过订阅资源来探索新内容。来自已订阅来源的新内容显示在“我的已保存来源”屏幕中。
还可以读取将多个数据集显示为图表的滑块样式信息图表。
成千上万的人已经在使用Infografz用于:
1)图片说出千个单词,因此他们想快速理解信息,更不用说信息地理学的美学吸引力
2)探索来自各种主题和来源的信息
3)以可视格式获取摘要级别的信息,而无需阅读大量文本
4)阅读新闻标题简短
Infografz - Discover Interesting Infographics - 版本1.0.29
(07-11-2020)Infografz - Discover Interesting Infographics - APK信息
APK版本: 1.0.29程序包: com.dataquarksInfografz - Discover Interesting Infographics的最新版本
其他版本


同类应用


